FOR IMMEDIATE RELEASE · Monday 12 October 2026
Weekly figures in this release: as at cycle 2026-W42 (published 11 October 2026). Q3 figures: Pitot Index® Q3 2026 industry reports.
The weekly AI Brand Rating, built on one standardised test across nine pinned AI models, today puts 13 Q3 2026 industry reports and Pulse AI brand health-checks on sale at pitotindex.com. The weekly scores remain free to read.
LONDON, 12 October 2026: The Pitot Index®, a weekly rating of how AI systems evaluate and recommend brands, today puts its first quarterly industry reports on sale, alongside Pulse, its AI brand health-check. The Q3 2026 edition covers 13 industries, from luxury fashion and watches to airlines, finance and consumer technology. It reads the full quarter of weekly measurement, in which every brand was given one standardised, unprompted test across nine pinned AI models. Hermès, Toyota and Porsche were #1 in their industries in every weekly cycle of the quarter.
What the Pitot Index measures
Marketers already track GEO and AEO: mentions, share of voice, sentiment, cited sources. Those are what show up in AI answers. Underneath is AI Brand Understanding (AIBU): how AI models understand a brand in the first place. The Pitot Index measures AIBU, and its score is the AI Brand Rating (AIBR). It is a different question from the one GEO and AEO answer, and a different instrument.
A thermometer without treatment only tells you something's wrong. Treatment without a diagnosis has to guess at the cause. The Pitot Index is the diagnosis; GEO and AEO are the treatment.
From the gaps to the causes. The weekly Pitot Index shows where the gaps are across an industry. The quarterly industry reports go brand by brand and region by region, with the positives and the negatives. Pulse sets out where a single brand stands and the most likely causes. The Audit confirms the causes and specifies the corrections. A single Pulse or Audit is a snapshot. Repeated, Pulses build a brand-specific AI Brand Rating baseline, read like for like, and so do Audits repeated on the same brief. Both sit alongside the public industry baseline the Pitot Index publishes every week.
The holes you can't see
During the Second World War, aircraft came back from combat covered in bullet holes, and the instinct was to armour the places that had been hit. The statistician Abraham Wald saw the flaw: the planes hit elsewhere were the ones that never came back to be counted. AI brand measurement has the same trap. What shows up in AI answers is real evidence, but it is the returning plane. AI Brand Understanding needs a test that looks at the whole aircraft.
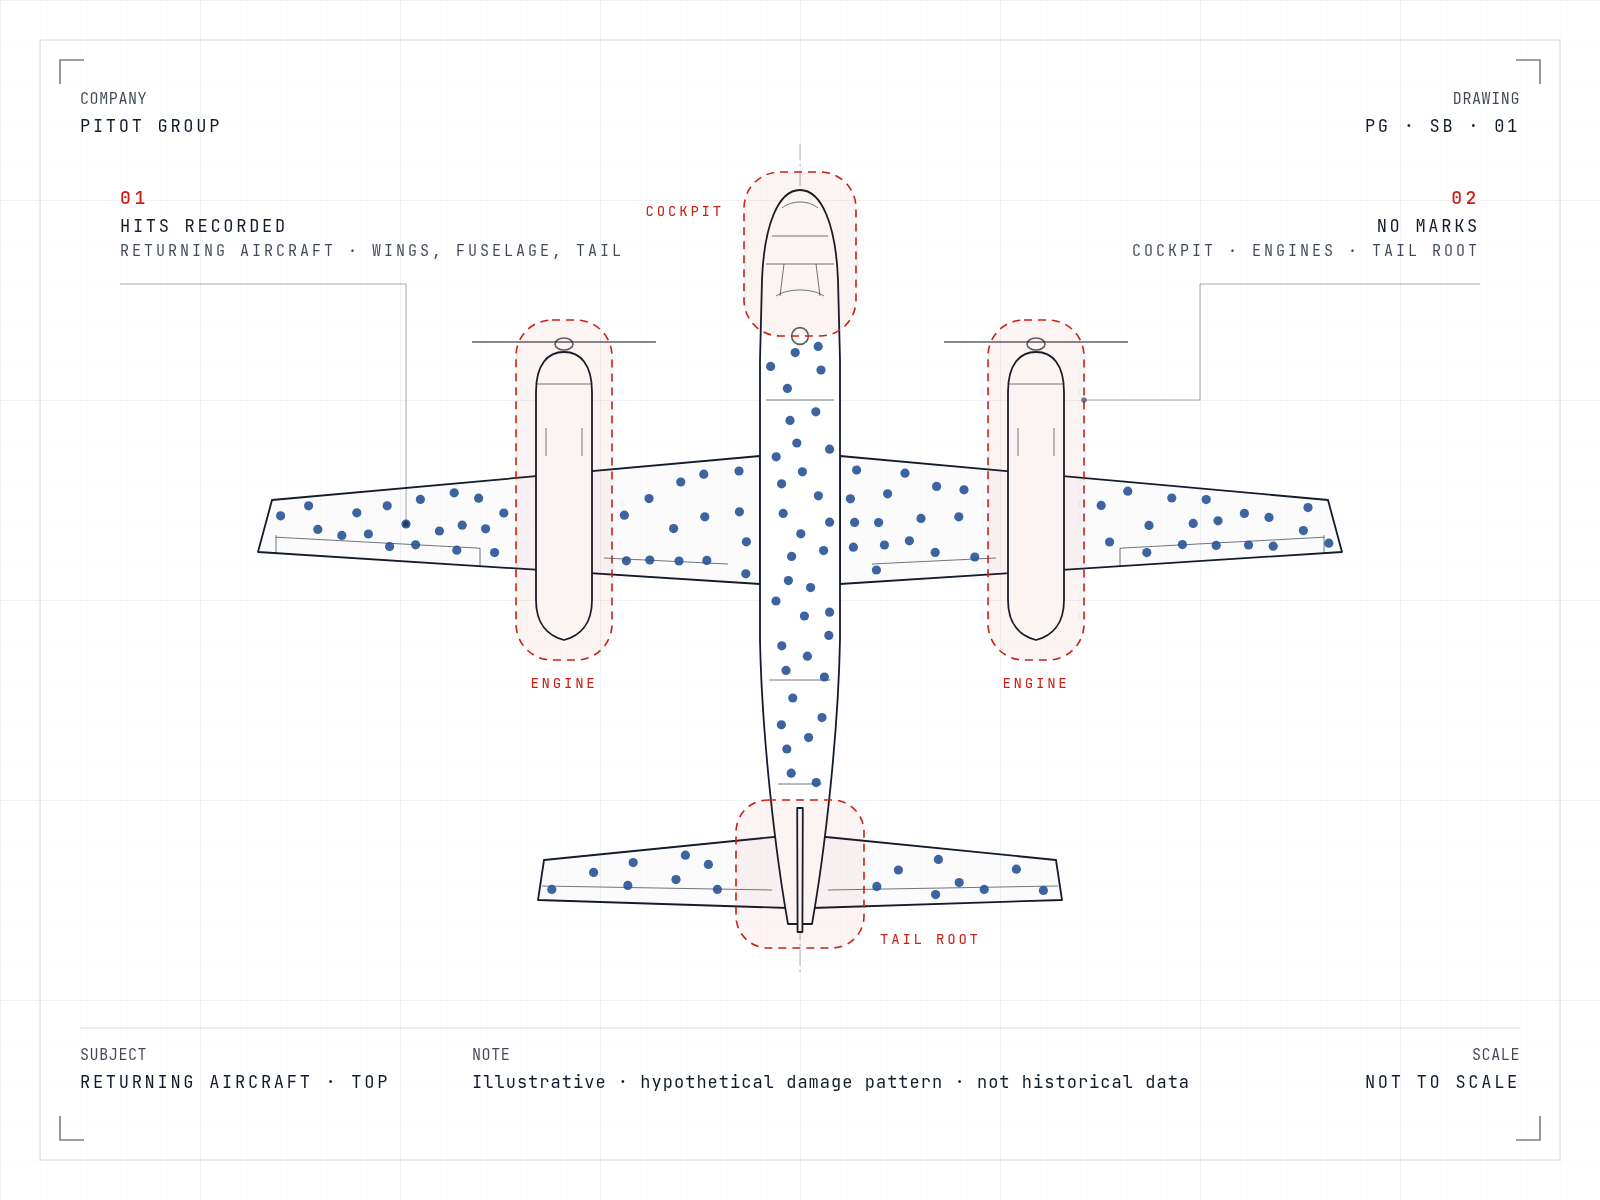

Reinforcement steered by returns strengthens where the hits show. In our view, optimisation steered only by the answers that already appear can put effort where a brand is already holding up, and can leave the real damage where it was. Reinforcement works best once you know where the real damage is.
The Pitot Index starts from the other end. Every question is written by Pitot Group for the research; none is taken from real AI usage, so no one's search habits decide what gets measured. The AI systems are never told which brands to discuss: they discover the brands themselves, each cycle. Every brand faces the same test, so a weak point reads as a gap against its peers, not as silence.
What the Q3 record shows
Three brands were #1 in every weekly cycle of Q3: Hermès in Luxury Fashion (Q3 average score 86.3), Toyota in Mainstream Automotive (82.1) and Porsche in Performance Automotive (82.2). Below them, the order was equally settled: Chanel was #2 in Luxury Fashion in every one of the 11 cycles, and Toyota and Honda held the first two places in Mainstream Automotive, in that order, in every one of the 11 cycles. In Luxury Automotive, Rolls-Royce leads the quarter (83.1); Rolls-Royce, Porsche, Ferrari and Mercedes-Benz occupied the first four positions in every one of the 12 cycles, and the order alone changed.
Elsewhere the tables were closer. In Beauty, Shiseido's Q3 average score is 0.2 points above L'Oréal's (75.0 v 74.8), Estée Lauder and Chanel are level on 74.3, and three brands were #1 during the quarter. In Spirits, Hennessy leads (80.2), while Macallan (77.9), Johnnie Walker (77.2) and Glenfiddich (77.0) are within 0.9 points of one another for second to fourth. In Watches, Patek Philippe leads (84.6), and Vacheron Constantin, Audemars Piguet, Omega and Jaeger-LeCoultre are separated by 1.7 points of Q3 average score.
Being named is not the same as being rated highly. In Luxury Fashion, Chanel has the highest unprompted salience, while Hermès, third on salience, is #1 in the rating. In Consumer Technology, the models' field mixes device makers with chip, software and online-services companies: NVIDIA, Intel, Microsoft, Google and Amazon. NVIDIA was #1 in 7 of the 11 weekly cycles; Apple leads the quarter on Q3 average score (78.0). Across most industries, Reputation is the weakest of the five rated dimensions: in Finance its industry average is 42.0, against 66.6 for Authority. The exceptions are Hospitality (Context), Spirits (Expertise Visibility) and Watches (Authority).
Sector highlights: the Q3 2026 edition (13 industries)
Each report ranks brands by their Q3 average score (scores out of 100).
| Industry | Q3 #1 | Q3 average score | Weekly cycles at #1 |
|---|---|---|---|
| Luxury Automotive | Rolls-Royce | 83.1 | 9 of 12 |
| Performance Automotive | Porsche | 82.2 | 11 of 11 |
| Mainstream Automotive | Toyota | 82.1 | 11 of 11 |
| Luxury Fashion | Hermès | 86.3 | 11 of 11 |
| Mainstream Fashion | Uniqlo | 72.5 | 7 of 11 |
| Sportswear | Nike | 75.6 | 10 of 11 |
| Watches | Patek Philippe | 84.6 | 10 of 11 |
| Spirits | Hennessy | 80.2 | 9 of 11 |
| Airlines | Singapore Airlines | 80.6 | 10 of 11 |
| Hospitality | Four Seasons | 83.0 | 10 of 11 |
| Beauty | Shiseido | 75.0 | 6 of 11 |
| Consumer Technology | Apple | 78.0 | 4 of 11 |
| Finance | JPMorgan Chase | 75.5 | 8 of 11 |
Source: Pitot Index® Q3 2026 industry reports. The Q3 average score is the sum of a brand's weekly scores over the ten published cycles from 2026-W30 to W40 other than the flagged W39, divided by ten; a week in which the brand was not in the measured ten counts as 0. Luxury Automotive's record also includes cycle 2026-W28, so it has 12 published cycles.
The weekly record, as at W42
As at cycle 2026-W42, published on 11 October 2026:
- Hermès, at 84.9, has been #1 in Luxury Fashion for 13 consecutive weekly cycles, W30 to W42.
- Toyota, at 81.6, has been #1 in Mainstream Automotive for 13 consecutive weekly cycles. Honda is second at 78.7.
- Porsche, at 82.1, has been #1 in Performance Automotive for 13 consecutive weekly cycles.
- Singapore Airlines, at 80.9, has been #1 in Airlines for 12 consecutive weekly cycles, every week since W31.
- In EV Automotive, BYD is #1 at 76.9 and has led every EV cycle since the industry joined the Index in W37.
Consecutive-week counts include cycle 2026-W39, which is flagged on pitotindex.com. In Watches, Patek Philippe was #1 in 10 of the 11 Q3 cycles; Rolex was #1 in W39, the flagged cycle in which one AI system returned empty answers to most questions.
EV Automotive joined the Index in September. Its first report is in the Q4 2026 edition, so it is not part of Q3.
"We never tell the models which brands to discuss. Nine pinned AI models are given the same questions every week, they name the brands themselves, and the scoring is automated from start to finish. Every brand in an industry takes the same test in the same week, and that is what makes the ratings comparable. A rating is not a verdict on a product. It describes how AI models currently represent a brand, and that can change."
— Andrea Maticevic, Founder, Pitot Index
How the Index works
The Pitot Index uses controlled measurement. Every brand is given one standardised, unprompted test across nine pinned AI models from Western, Chinese and Arabic-first developers. Every question is written by Pitot Group for the research, and none is taken from real AI usage. Every cycle we check for unannounced model switches by providers; any switch we find is logged with the date we found it. The models are never told which brands to discuss. Scores come from a standardised, documented method. There is no automated or client-facing way to change a reading, and no paid service can alter one. Where a known limitation of our method affects a figure, we say so in the report concerned. The figures as first published are kept in our records. Pitot Group separately offers paid audits and advisory work to brands, including brands we rate.
Brands are rated on five dimensions: Authority, Reputation, Expertise Visibility, Signal Consistency and Context. Because the test is standardised, we measure our own noise (how often each model changes its answer week to week), so a reported move can be read against the instrument's own variation. Each quarterly report ranks brands by their average score for the quarter. A cycle we flag as incomplete is left out, and the report says which one. W39 is left out of Q3 averages because one AI system returned empty answers to most questions in that cycle. From cycle 2026-W41, the Index uses ARES-C 2.3, an updated version of our method.
Pulse and the Audit share the same starting point, questions written for the research and none drawn from real usage, but they are prompted: the brand is named. Prompted and unprompted readings answer different questions and are never compared.
Availability and prices
- Now live: all 13 Q3 2026 industry reports and Pulse are on sale from Monday 12 October 2026 at pitotindex.com (pitotindex.com/pricing).
- Pitot Index industry reports from £3 a day. Annual subscription, one industry, individual licence: £1,095 billed annually.
- One-off quarterly industry reports from £365.
- Pulse AI brand health-checks: one-off from £430, or Monthly Pulse at £300 a check (six-month minimum). Pulse examines a brand, named directly, and reports where it stands in AI: orders paid by 14:00 UK are delivered as a PDF by 18:00 the same business day.
- Coverage: a single industry, a cluster bundle (Automotive, Fashion, Luxury Goods, Travel, Consumer Goods) or Full Access to every industry, for a single quarter or as an annual subscription.
- Licences: Individual (one named reader), Team (up to five readers) or Enterprise (up to fifteen readers, plus external quotation with attribution).
- Delivery: watermarked PDF within one business day of payment. Reports are licensed, not sold, and are sold to businesses.
- Prices are in pounds sterling. Pitot Group Ltd is not currently registered for VAT, so no VAT is charged. Full prices at pitotindex.com/pricing.
- EV Automotive: its first report is in the Q4 2026 edition. Single-quarter Full Access buyers receive it free on publication, and annual subscribers receive it as part of their subscription.
- The weekly scores, movements and the Signal Wire news feed remain free to read at pitotindex.com.
ENDS
Notes to editors
- How to cite: for example, Source: Pitot Index®, Luxury Fashion Top 10, cycle 2026-W42 (published 11 October 2026). For Q3 report figures: Source: Pitot Index®, Luxury Fashion Q3 2026 report. Short form: Pitot Index, Luxury Fashion, 2026-W42, Pitot Group. Scores run from 0 to 100 and are published to one decimal place. Charts and embeds are free for editorial use, as set out in our Terms (pitotindex.com/terms, clause 5.4).
- Terms: AI Brand Understanding (AIBU) is what the Pitot Index measures. The AI Brand Rating (AIBR) is the published Pitot Index score. A rating is an automated reading of what AI models output under a standardised test. It is not a measure of what customers do, and not a statement about a brand's quality or conduct.
- Press offer: each sector's Q3 cut, a chart, and time with Andrea Maticevic for interview or comment. Reports are licensed products, so no free copies are provided.
- Key dates: weekly measurement of the non-experimental version began on 7 July 2026 (Luxury Automotive cycle 2026-W28). The first quarterly industry reports and Pulse went on sale on 12 October 2026. Measurement is weekly and reporting is quarterly.
- W39: in cycle 2026-W39 one of the AI systems returned empty answers to most questions. Its results stay in the record but are not reported as movements. The cycle is flagged on site charts ("W39 · FLAGGED"), and a notice on /news explains it.
- Signal Wire: automated weekly briefs on significant movements at pitotindex.com/news (RSS: /news/feed.xml). Corrected stories are marked with a dated correction line.
- Independence: the AI systems discover the brands themselves. Scores come from a standardised, documented method. There is no automated or client-facing way to change a reading, and no paid service can alter one. Pitot Group separately offers paid audits and advisory work to brands, including brands we rate. The Pitot Index does not use private AI conversations or personal data.
- About the Pitot Index: the Pitot Index® is built and operated by Pitot Group Ltd, a London-based strategic marketing and AI company that builds its own measurement systems. It measures 14 industries weekly. Its measurement engine is proprietary to Pitot Group. PITOT INDEX® is a registered trade mark of Scauri Holdings Ltd, used under licence. Pitot Group Ltd is registered in England and Wales, company no. 17281727.
- Press resources: pitotgroup.com/press: release, logos (pitotgroup.com/press/files/pitot-index-logos-png.zip) and founder photo (pitotgroup.com/press/files/andrea-maticevic-founder-pitot-group.jpg). Methodology: pitotindex.com/methodology. Charts and sector data on request from [email protected].
- Survivorship drawing: original Pitot Group artwork; no third-party image was traced or used. Illustrative, hypothetical damage pattern; not historical data.
Press contact
Pitot Group
[email protected] · pitotindex.com · pitotgroup.com/press
Interviews with our founder, Andrea Maticevic, are available on request.